arena = dx.Arena()
arena.push_model(explainer_cdc)
arena.push_model(explainer_dtc)
arena.push_model(explainer_rfc)
arena.push_model(explainer_rfc_tuned)
arena.push_observations(Steve)

arena.run_server()Step 10. Model Deployment

We have made the model built for Covid data, along with the explanations described in this book, available at https://crs19.mi2.ai/ webpage. After two months, tens of thousands of people used it. With proper tools the deployment of such a model is not difficult.
To obtain a safe and effective model, it is necessary to perform a~detailed Explanatory Model Analysis. However, we often don’t have much time for it. That is why tools that facilitate fast and automated model exploration are so useful.
Python snippets
If we want to automate comparison of several models, Arena is a very convenient tool for such exploration. It can work in two modes: live (with the server which adds the necessary statistics on the fly) or pre-calculated statistics. In the case of many models and large datasets, the live mode is much more convenient.
The snippet below turns four covid models into a dashboard.
An example dashboard built for a model for dozens of variables and several thousand rows on football player worth prediction based on the FIFA dataset is available at https://arena.drwhy.ai/?demo=1.
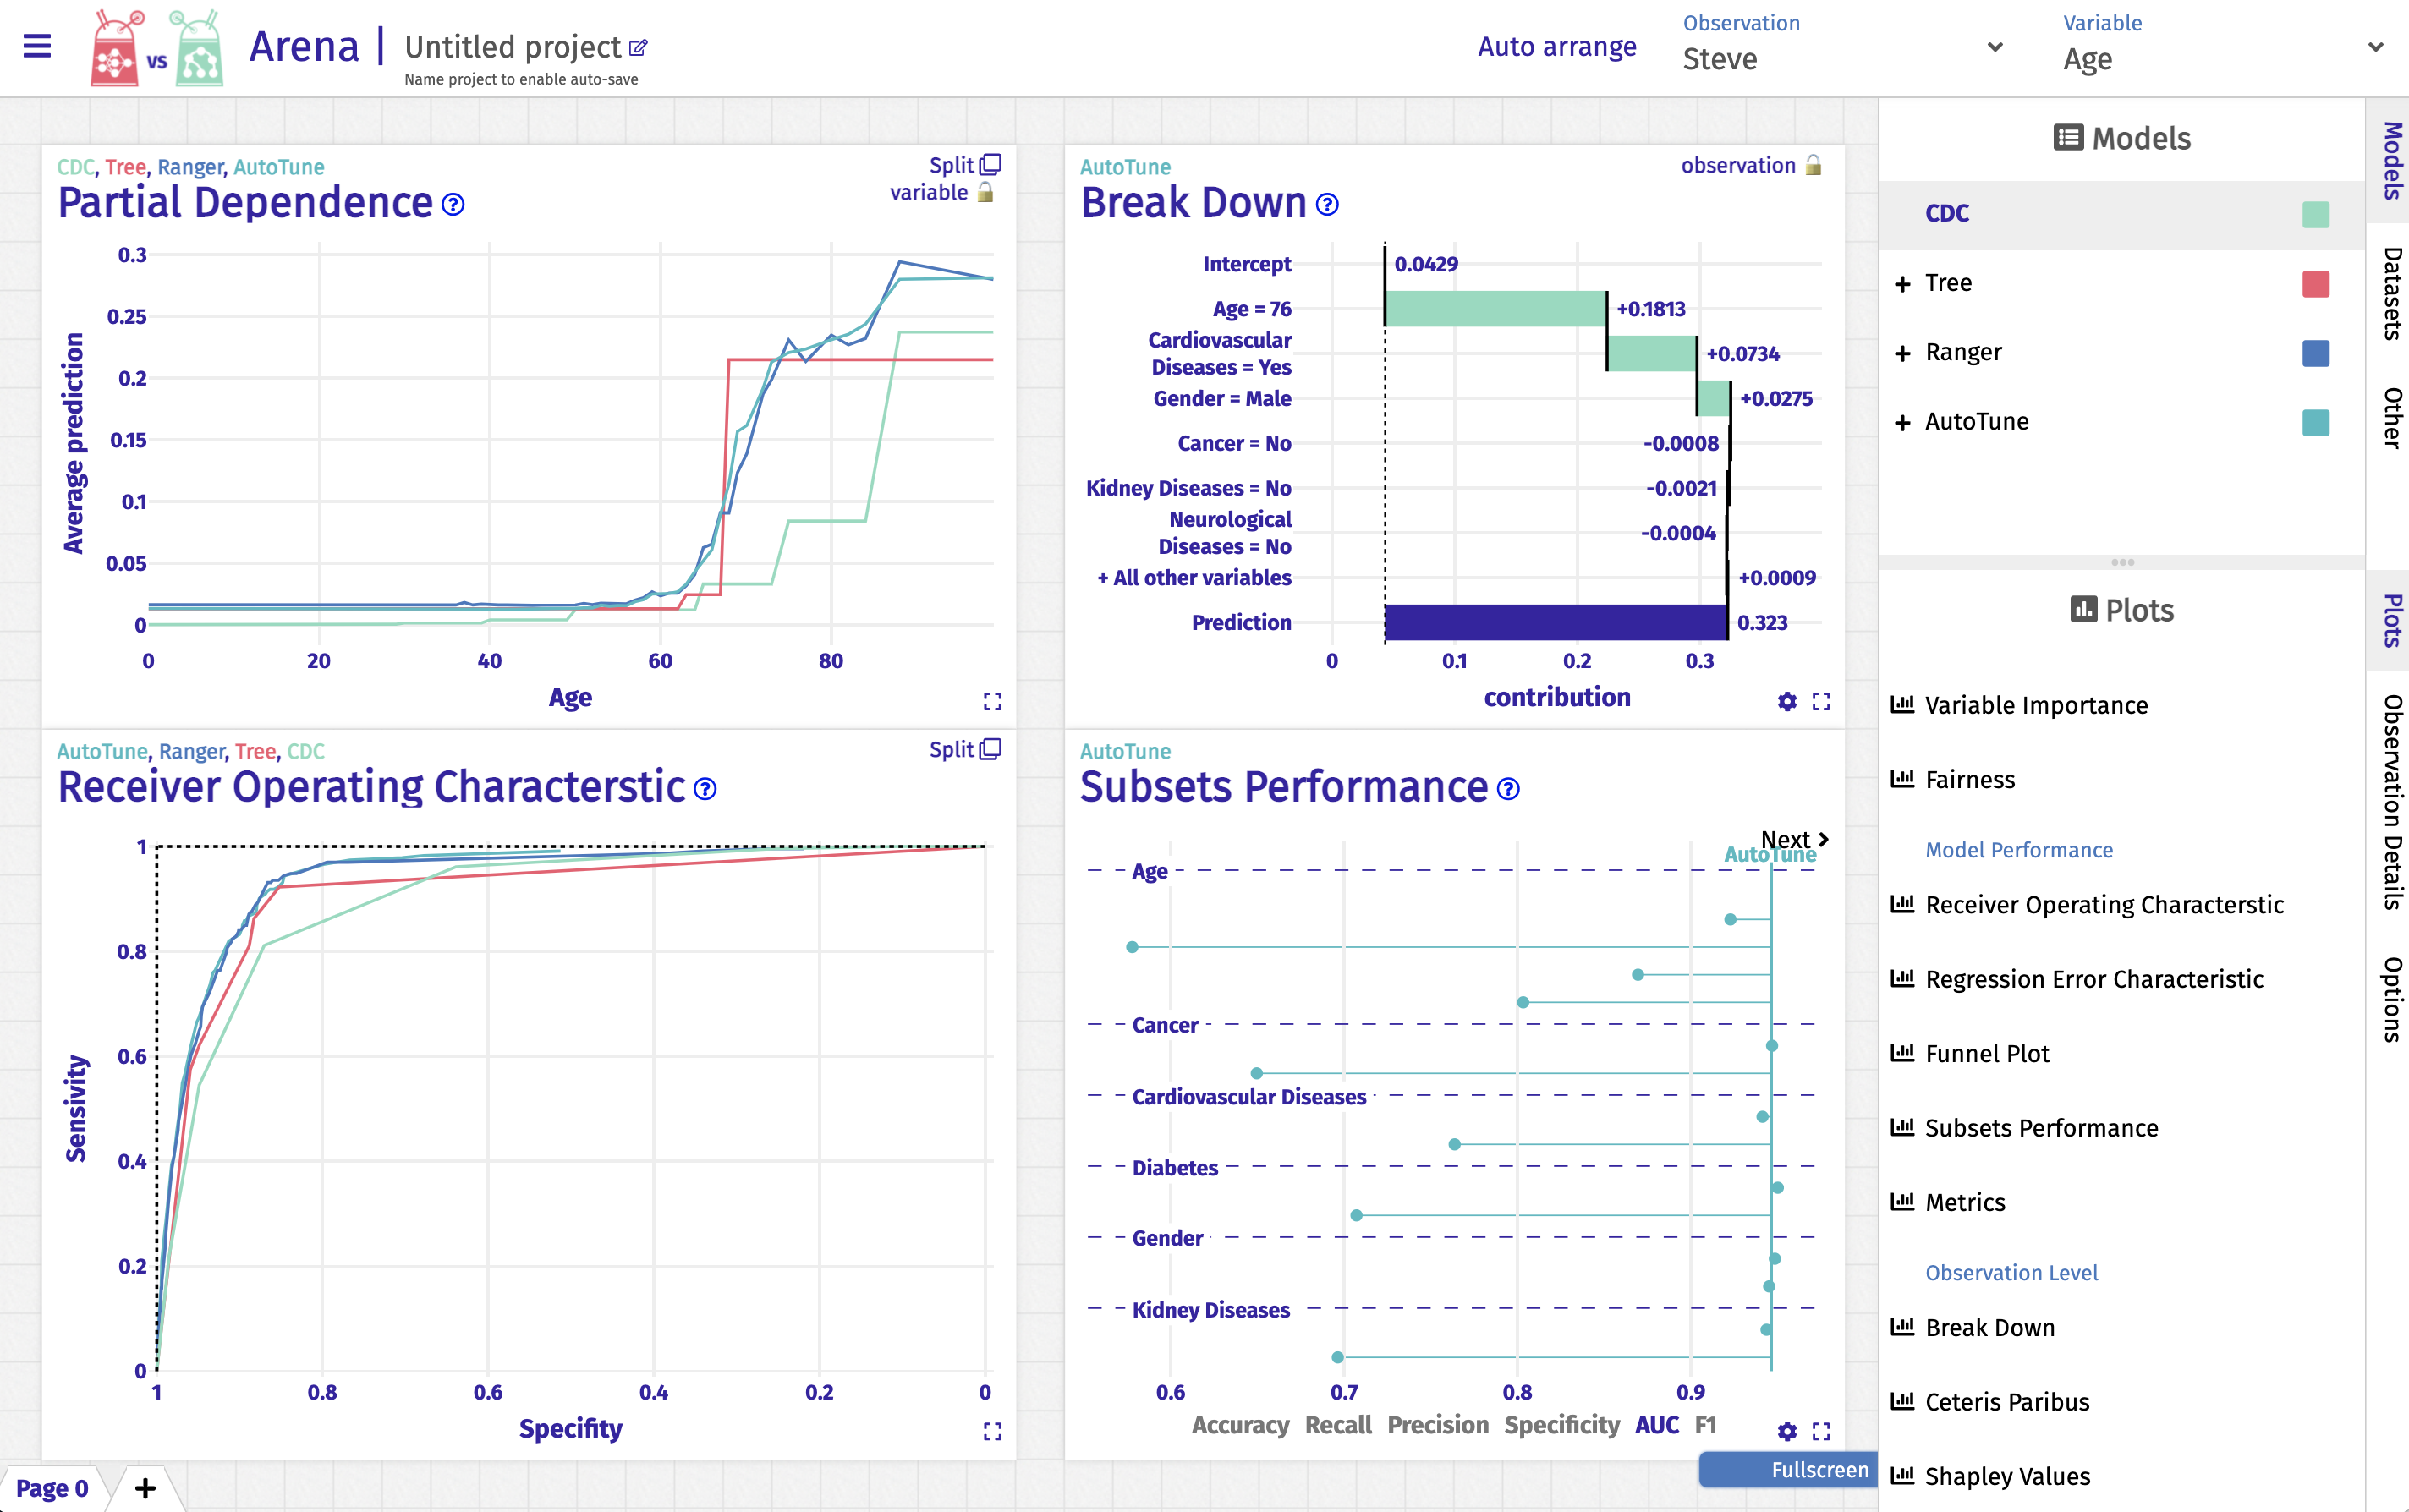
Arena web application that facilitates exploration of multiple models.R snippets
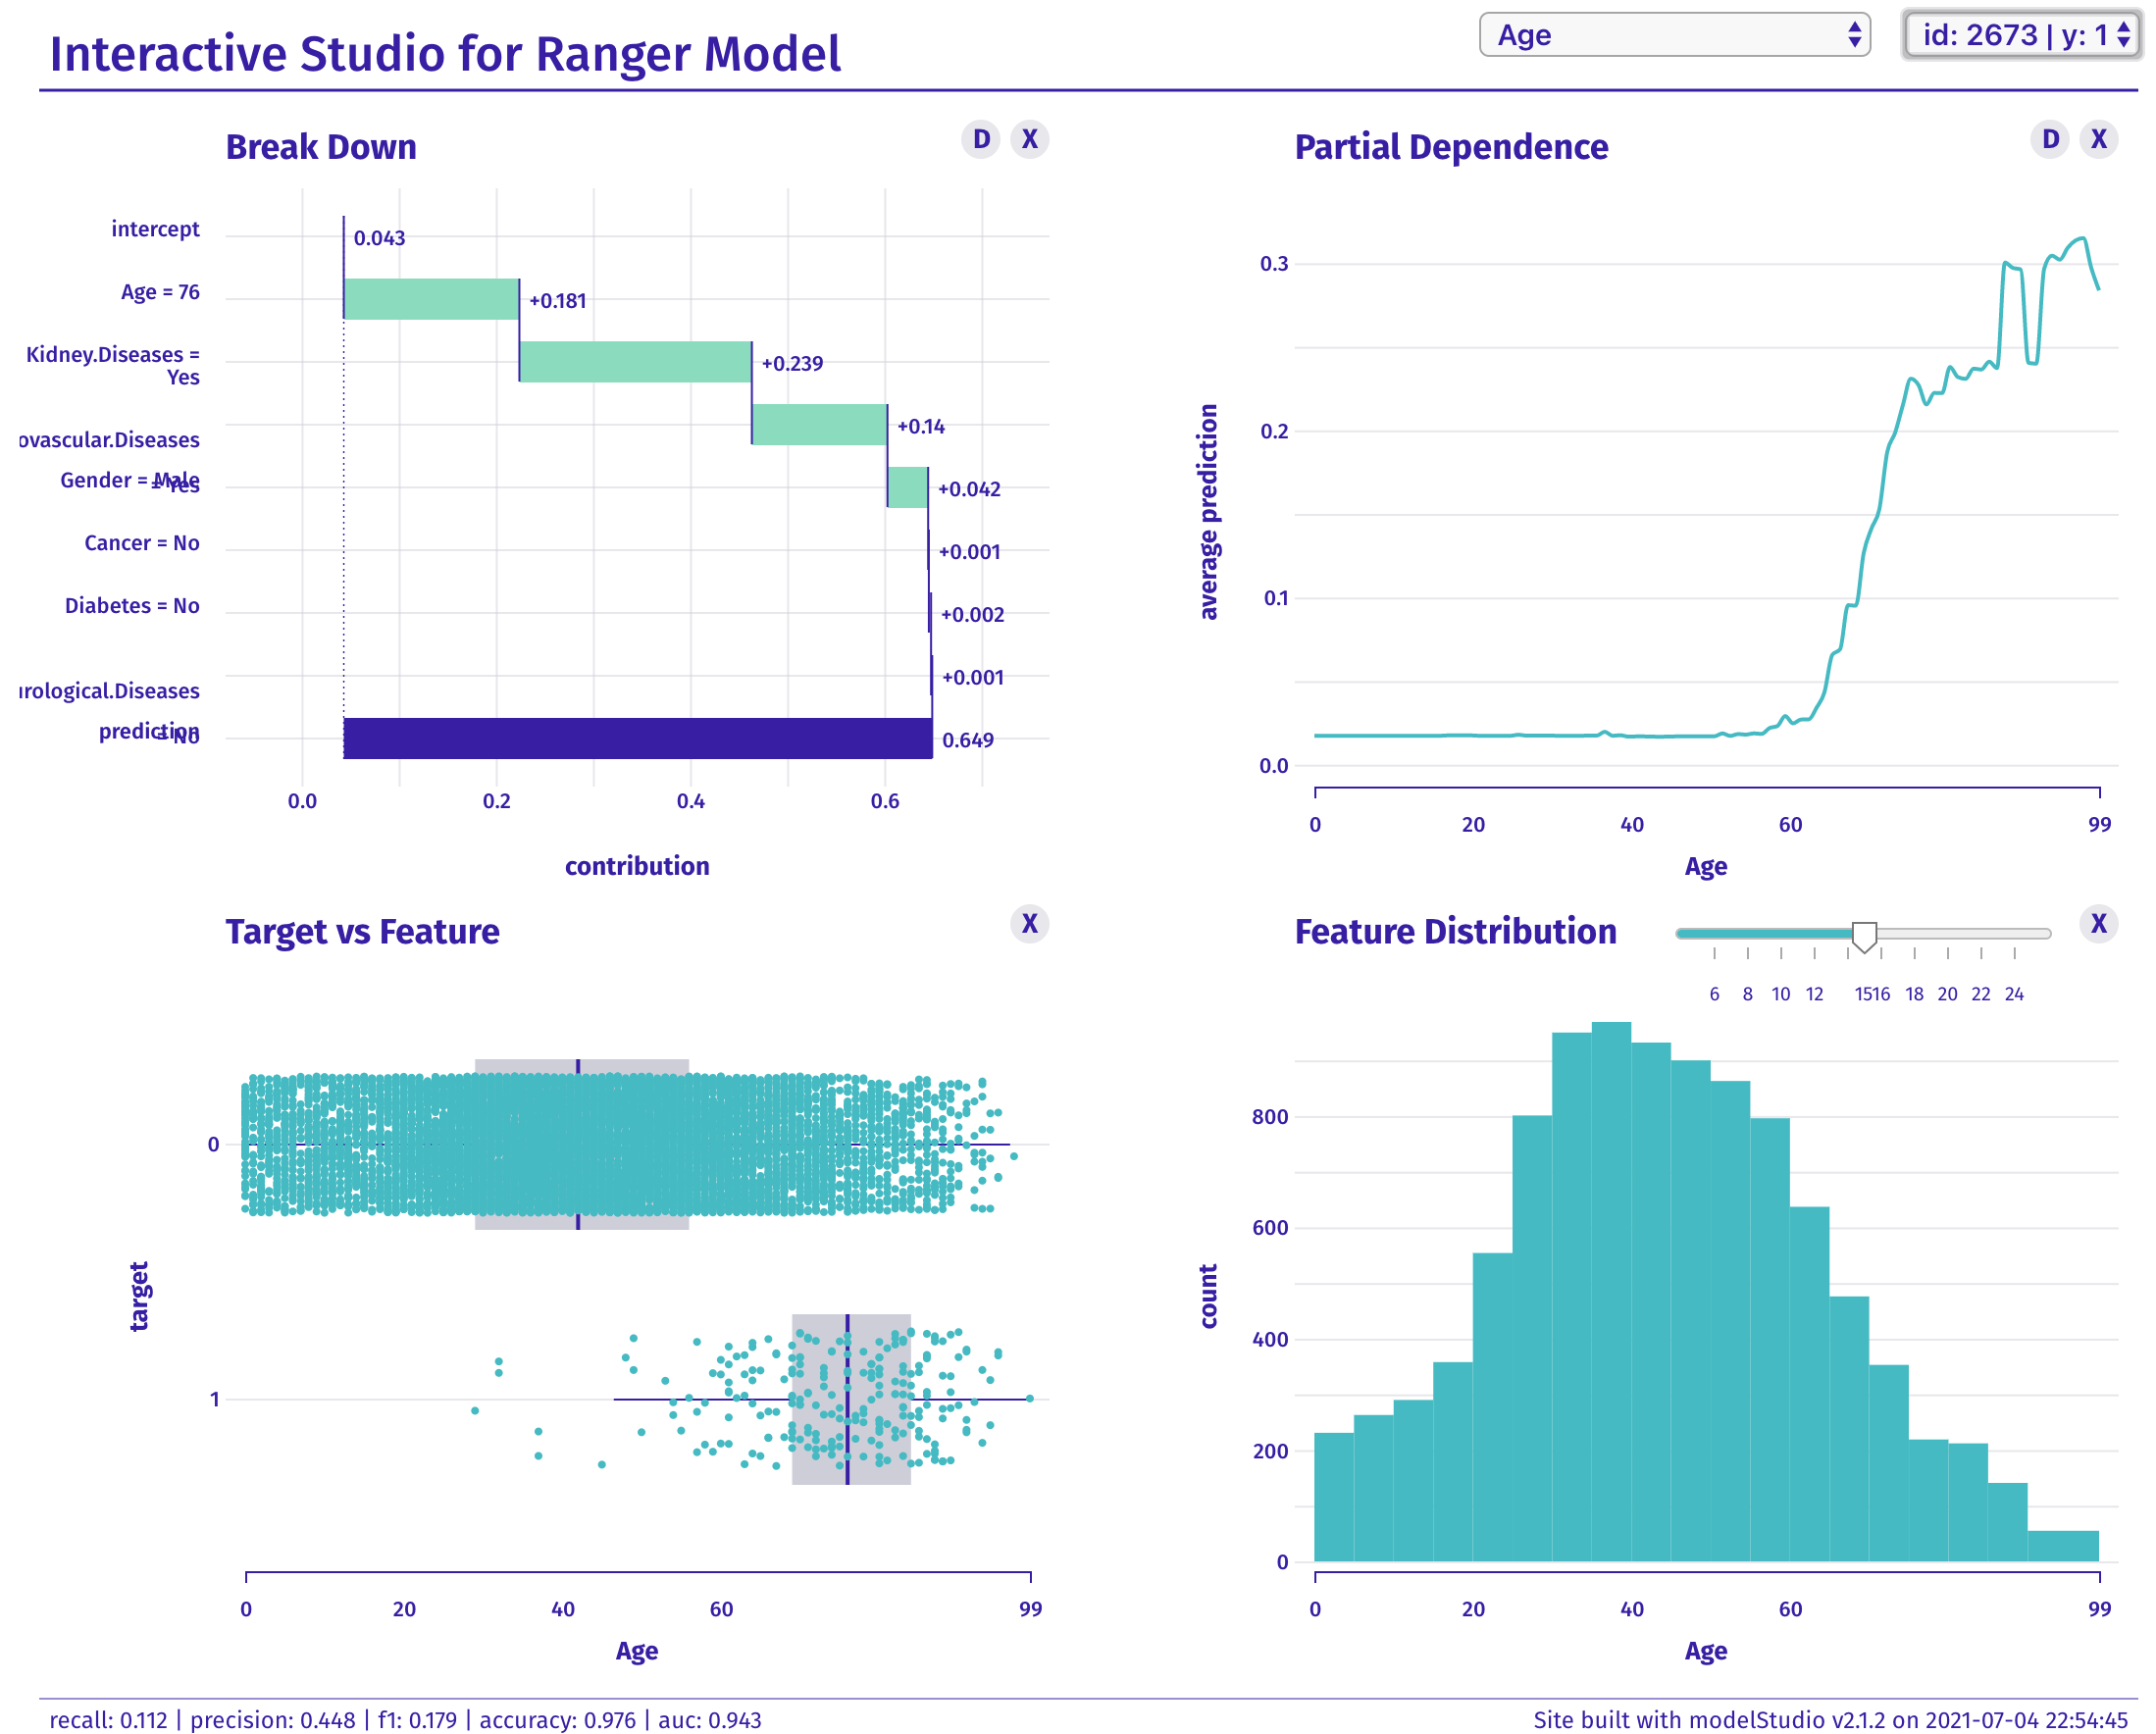
In R one of such tools is modelStudio (Baniecki and Biecek 2020). It is a package that transforms an explainer into an HTML page with javascript based interaction. Such an HTML page is easy to save on a disk or share by email. The webpage has various explanations pre-calculated, so its generation may be time-consuming, but the model exploration is very fast, and the feedback loop is tight.
Baniecki, Hubert, and Przemyslaw Biecek. 2020. “The Grammar of Interactive Explanatory Model Analysis.” Arxiv. https://arxiv.org/abs/2005.00497.
Generating a modelStudio for an explainer is trivially easy.
library("modelStudio")
ms <- modelStudio(model_ranger)
ms
An example dashboard built for a model for dozens of variables and several thousand rows on football player worth prediction based on the FIFA dataset is available at https://pbiecek.github.io/explainFIFA20/.
The dashboard is created with the create_arena function. Then with push_model and push_observations, one can add more models and more observations for model exploration. The resulting object can be turned into the live web application with the run_server function.
The snippet below turns four covid models into a dashboard.
library("arenar")
library("dplyr")
covid_ar <- create_arena(live = TRUE) %>%
    push_model(model_cdc) %>%
    push_model(model_tree) %>%
    push_model(model_ranger) %>%
    push_model(model_tuned) %>%
    push_observations(Steve)
run_server(covid_ar)